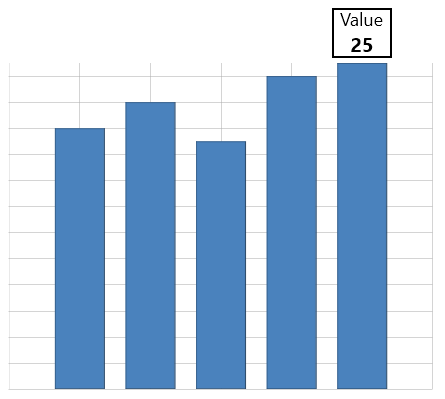
You can easily create a simple bound marker by setting five properties. The XAML markup below demonstrates this:
| XAML |
Copy Code
|
|---|---|
<c1:C1Chart.View>
    <c1:ChartView>
        <!-- Markers layer -->
        <c1:ChartView.Layers>
            <c1:ChartPanel>
                <!-- simple bound marker -->
                <c1:ChartPanelObject x:Name="obj" Attach="DataX"
                                     Action="MouseMove"
                                     DataPoint="-1,-1"
                                     HorizontalAlignment="Center"
                                     VerticalAlignment="Top"
                                     Width="60" Height="50">
                    <c1:ChartPanelObject.RenderTransform>
                        <TranslateTransform Y="-55"/>
                    </c1:ChartPanelObject.RenderTransform>
                    <Border BorderBrush="Black" BorderThickness="2">
                        <Grid DataContext="{Binding ElementName=obj}" Width="100" Height="50" HorizontalAlignment="Center" Background="White" >
                            <StackPanel VerticalAlignment="Center" HorizontalAlignment="Center">
                                <TextBlock Text="Value" FontSize="18" Margin="2 0" Foreground="Black" />
                                <TextBlock Text="{Binding DataPoint.Y}" TextAlignment="Center" Foreground="Black" FontSize="20" FontWeight="Bold" Margin="2"/>
                            </StackPanel>
                        </Grid>
                    </Border>
                </c1:ChartPanelObject>
            </c1:ChartPanel>
        </c1:ChartView.Layers>
    </c1:ChartView>
</c1:C1Chart.View>
|
|
Note that you're setting the following properties:
- Attach = DataX
- Action = MouseMove
- DataPoint = -1,-1
- HorizontalAlignment = Center
- VerticalAlignment = Top
The application will resemble the following image:
